
How Mookie Betts Became a More Productive Power Hitter than Giancarlo Stanton
I would rather have Mookie Betts in the middle of my lineup than Giancarlo Stanton.
Now, to most people this would seem ridiculous. Even after Betts’ MVP type season people would tend to think the 6’5” 245lb Stanton (2017 NL MVP) would out-slug the 5’9” 180lb Betts. On the surface level it may seem that Stanton had a more productive year, out homering Betts (38 to 32) and also driving in 20 more runs. But, after digging deeper into the analytics, the numbers told a very different story.

2018 Regular Season Production
Credit: Baseballsavant.com
After looking at the chart above, it becomes obvious that Betts was a more productive power hitter during the 2018 season. He eclipsed Stanton in most of the major categories and if he was afforded the same number of at-bats, one could assume he would have equaled or passed Stanton in home runs and RBIs as well.
Further studying the numbers, as well as analyzing each of their swings begins to paint a clearer picture on why someone who is 9 inches shorter and 65lbs lighter could outhit a former MVP…
Launch Angle
The most dreaded word to some “old-school” baseball fans and former players, launch angle is proving to be an increasingly important statistic and its relationship to power numbers is undeniable. When comparing the launch angles of these two players, Betts has a massive advantage compared to Stanton, while their average exit velocities are similar. This is not only shown in the chart above, but also below:
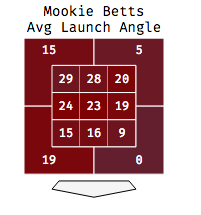
Credit: baseballsavant.com

*Note that Stanton has a hard time elevating balls down in the zone and also away from him, which we will revisit later.
When looking at an extremely large sample size, higher launch angles (up to a point, 35 degrees or so) produce higher power output, more doubles and more home runs. With Stanton’s average launch angle just over 11.5 degrees, and Mookie’s over 18 degrees, the power numbers should come as no surprise.
Below, please examine the chart that shows various offensive statistics by launch angles across the entirety of Major League Baseball.

2017 Statistics
Credit: baseballsavant.com
Notice the spike in 2B% and HR% as the launch angles continue to climb.
2. Exit Velocity vs. “Effective Exit Velocity”
Exit Velocity is the other primary statistic that is tracked and talked about increasingly frequently in baseball and has a direct effect on the result of a batted ball. “Effective Exit Velocity”, is a term we use to describe balls hit with a high exit velocity (‘high’ is relative to the hitter, for now lets call it 95mph+) between the angles of 10 and 30 degrees. This is important because, at the highest level, data shows the significant power output increases within this range. The chart below shows statistics based on each player’s average launch angle combined with 95+mph exit velocities at those angles (Stanton 12 Degrees and Betts 18).

2017 Season
Credit: baseballsavant.com
Digging Deeper - Analysis
This data raises possibly the most interesting question when comparing these two players. If Stanton’s average launch angle is 12 Degrees, and the MLB batting average at that launch angle is over .700, why did he struggle to hit over .260, while Betts is going to likely take home the AL MVP? We believe there is a distinct different between the swing paths which allows Betts to drive the ball to all fields at his size, while also limiting Stanton.
Swing Path
Looking deeper into both of these players swings, swing path differences stood out the most. Mookie Betts, especially in 2018, has one of the most efficient swings paths in baseball, allowing him to keep the barrel of his bat in the zone for a long time, while also being able to frequently drive the ball in the air to all fields. (Seen on the left)

On the other hand, Giancarlo Stanton (seen above, on the right) tends to have a much “steeper” bat path, keeping his barrel in the zone for a much shorter period of time, drastically limiting his ability to adjust to off-speed pitches or balls down and away from him in the zone. Steeper bat paths will often lead to balls driven directly into the ground (granted at very high velocities) or “backspun/overspun” balls that almost flare up into the air like a golf ball stricken off a lob wedge, not to mention 200+ strikeouts.
This takes us back to the "Launch angle by location” chart from earlier. Stanton has extreme success at elevating the ball up and in to him where his bat would not have to travel as far “downward”, allowing his path to be flatter and sometimes even working at a slightly upward angle. This changes completely on the ball down in the zone, as well as away from him where often his bat will enter the zone at a steeper angle, creating much more room for error.
We must always remember that a baseball is entering the hitting zone at a slight downward angle, and in order to match that "plane” with our bat, a bat path moving slightly upward is going to give each hitter the best chance at consistent success.

Credit: “The Science of Hitting” by Ted Williams
Although Stanton’s sheer strength and size allow him to have success at the Major League level now, what will his swing look like in year 2027 when he is still getting paid $25 Million, at age 37?
Only time will tell, but my $300 Million would go to Mookie well before Giancarlo.